Visual Standards for tsunami evacuation information originated from examining the taxonomy of semiotics and visualization currently used in two approaches of evacuation information; 1) city evacuation instructions and 2) airline evacuation cards. These two formats provided a comparison of visual representation and effectiveness, the influence of regulation (or lack thereof), and the assessment of path-knowledge for the people who access the information.
The application of cognitive phenomena was considered in assessing current models of information and the potential of a redesign. Cognitive phenomena include collective behavior, tunnel vision, and issues in temporary cognitive paralysis. A cognitive recall study was completed in order to measure performance outcomes between audio, written, and visual presentation of information. Download the full case study and research support.
Visual Standards for Tsunami Evacuation Information project is endorsed by the California Governor’s Office of Emergency Services, National Oceanic and Atmospheric Administration, the United States Geological Survey, and the Design Network for Emergency Management.
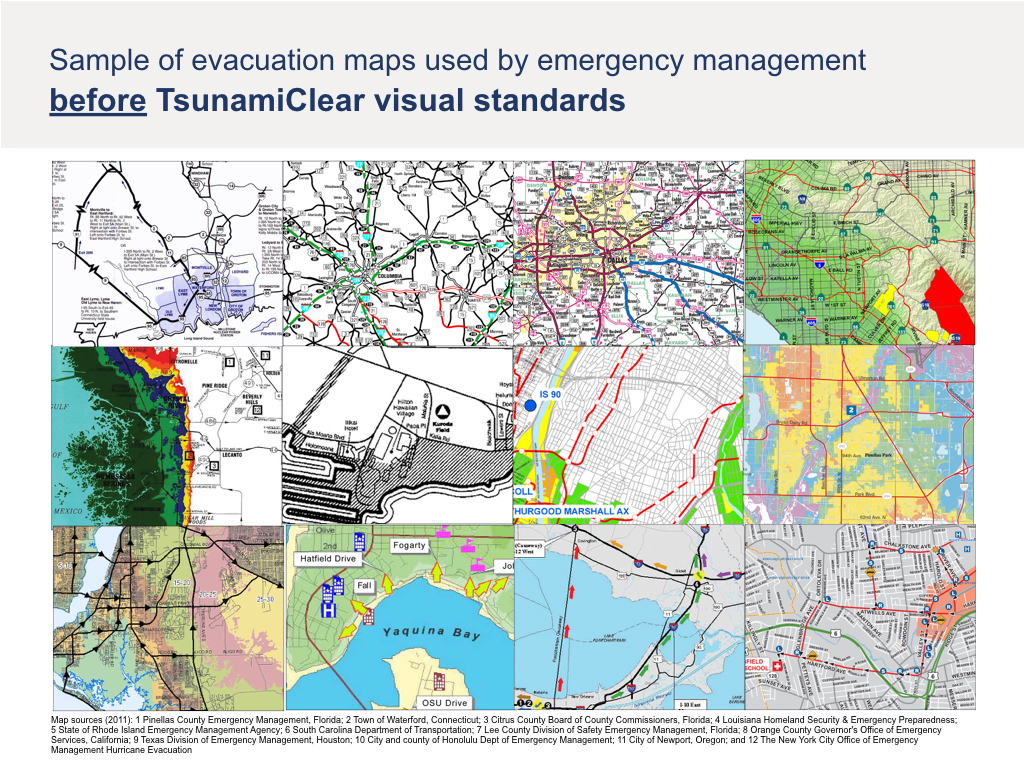
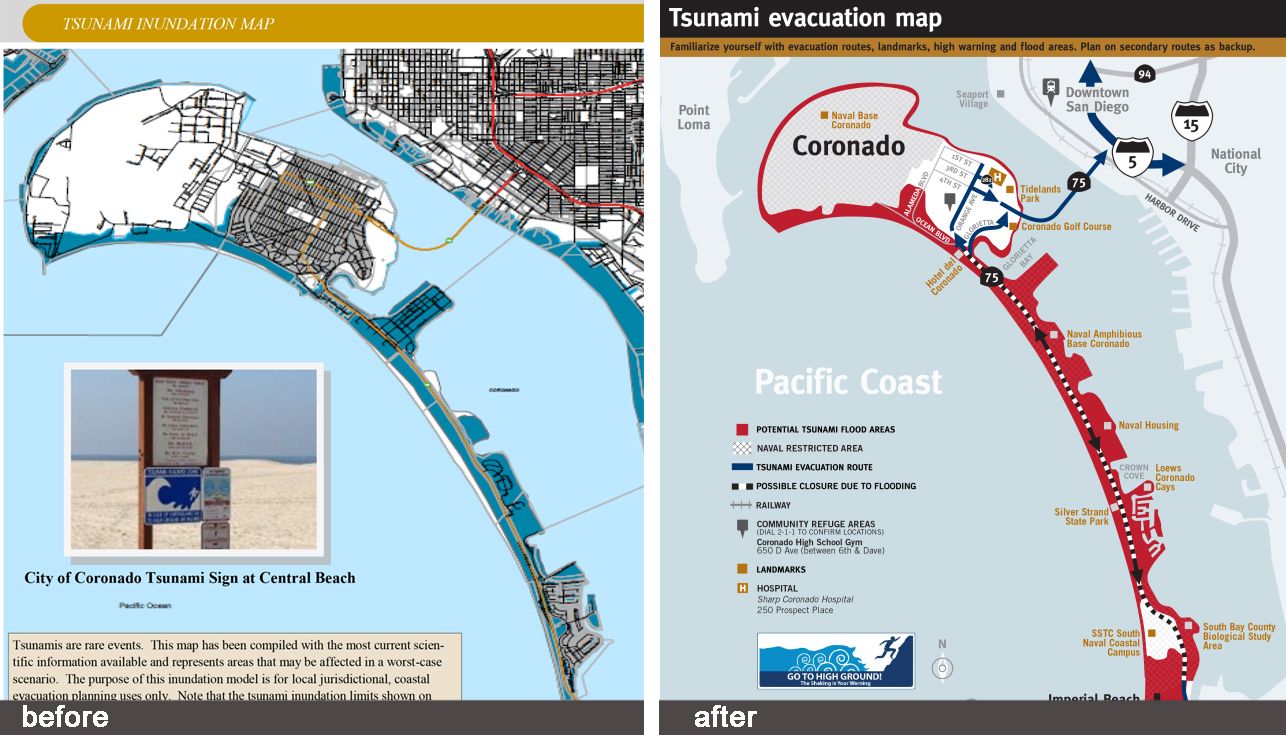
Above are original public-facing evacuation instructions provided by Emergency Management agencies in the United States. The first thing I noticed was that they are all maps. My next question was why. To the everyday person, maps require a specific and higher-level skill set to decode and gain meaningful information. The maps were also inconsistent in how they looked and how they were made. They varied in density, color coding, typography, hierarchy, and overall symbology.
After redesigning the map with TsunamiClear visual standards, we tested it in a cognitive recall study. We tested audio, written, and visual (TsunamiClear map) formats of information. Participants were able to remember information with more accuracy and for a longer period of time with maps compared to the other formats.
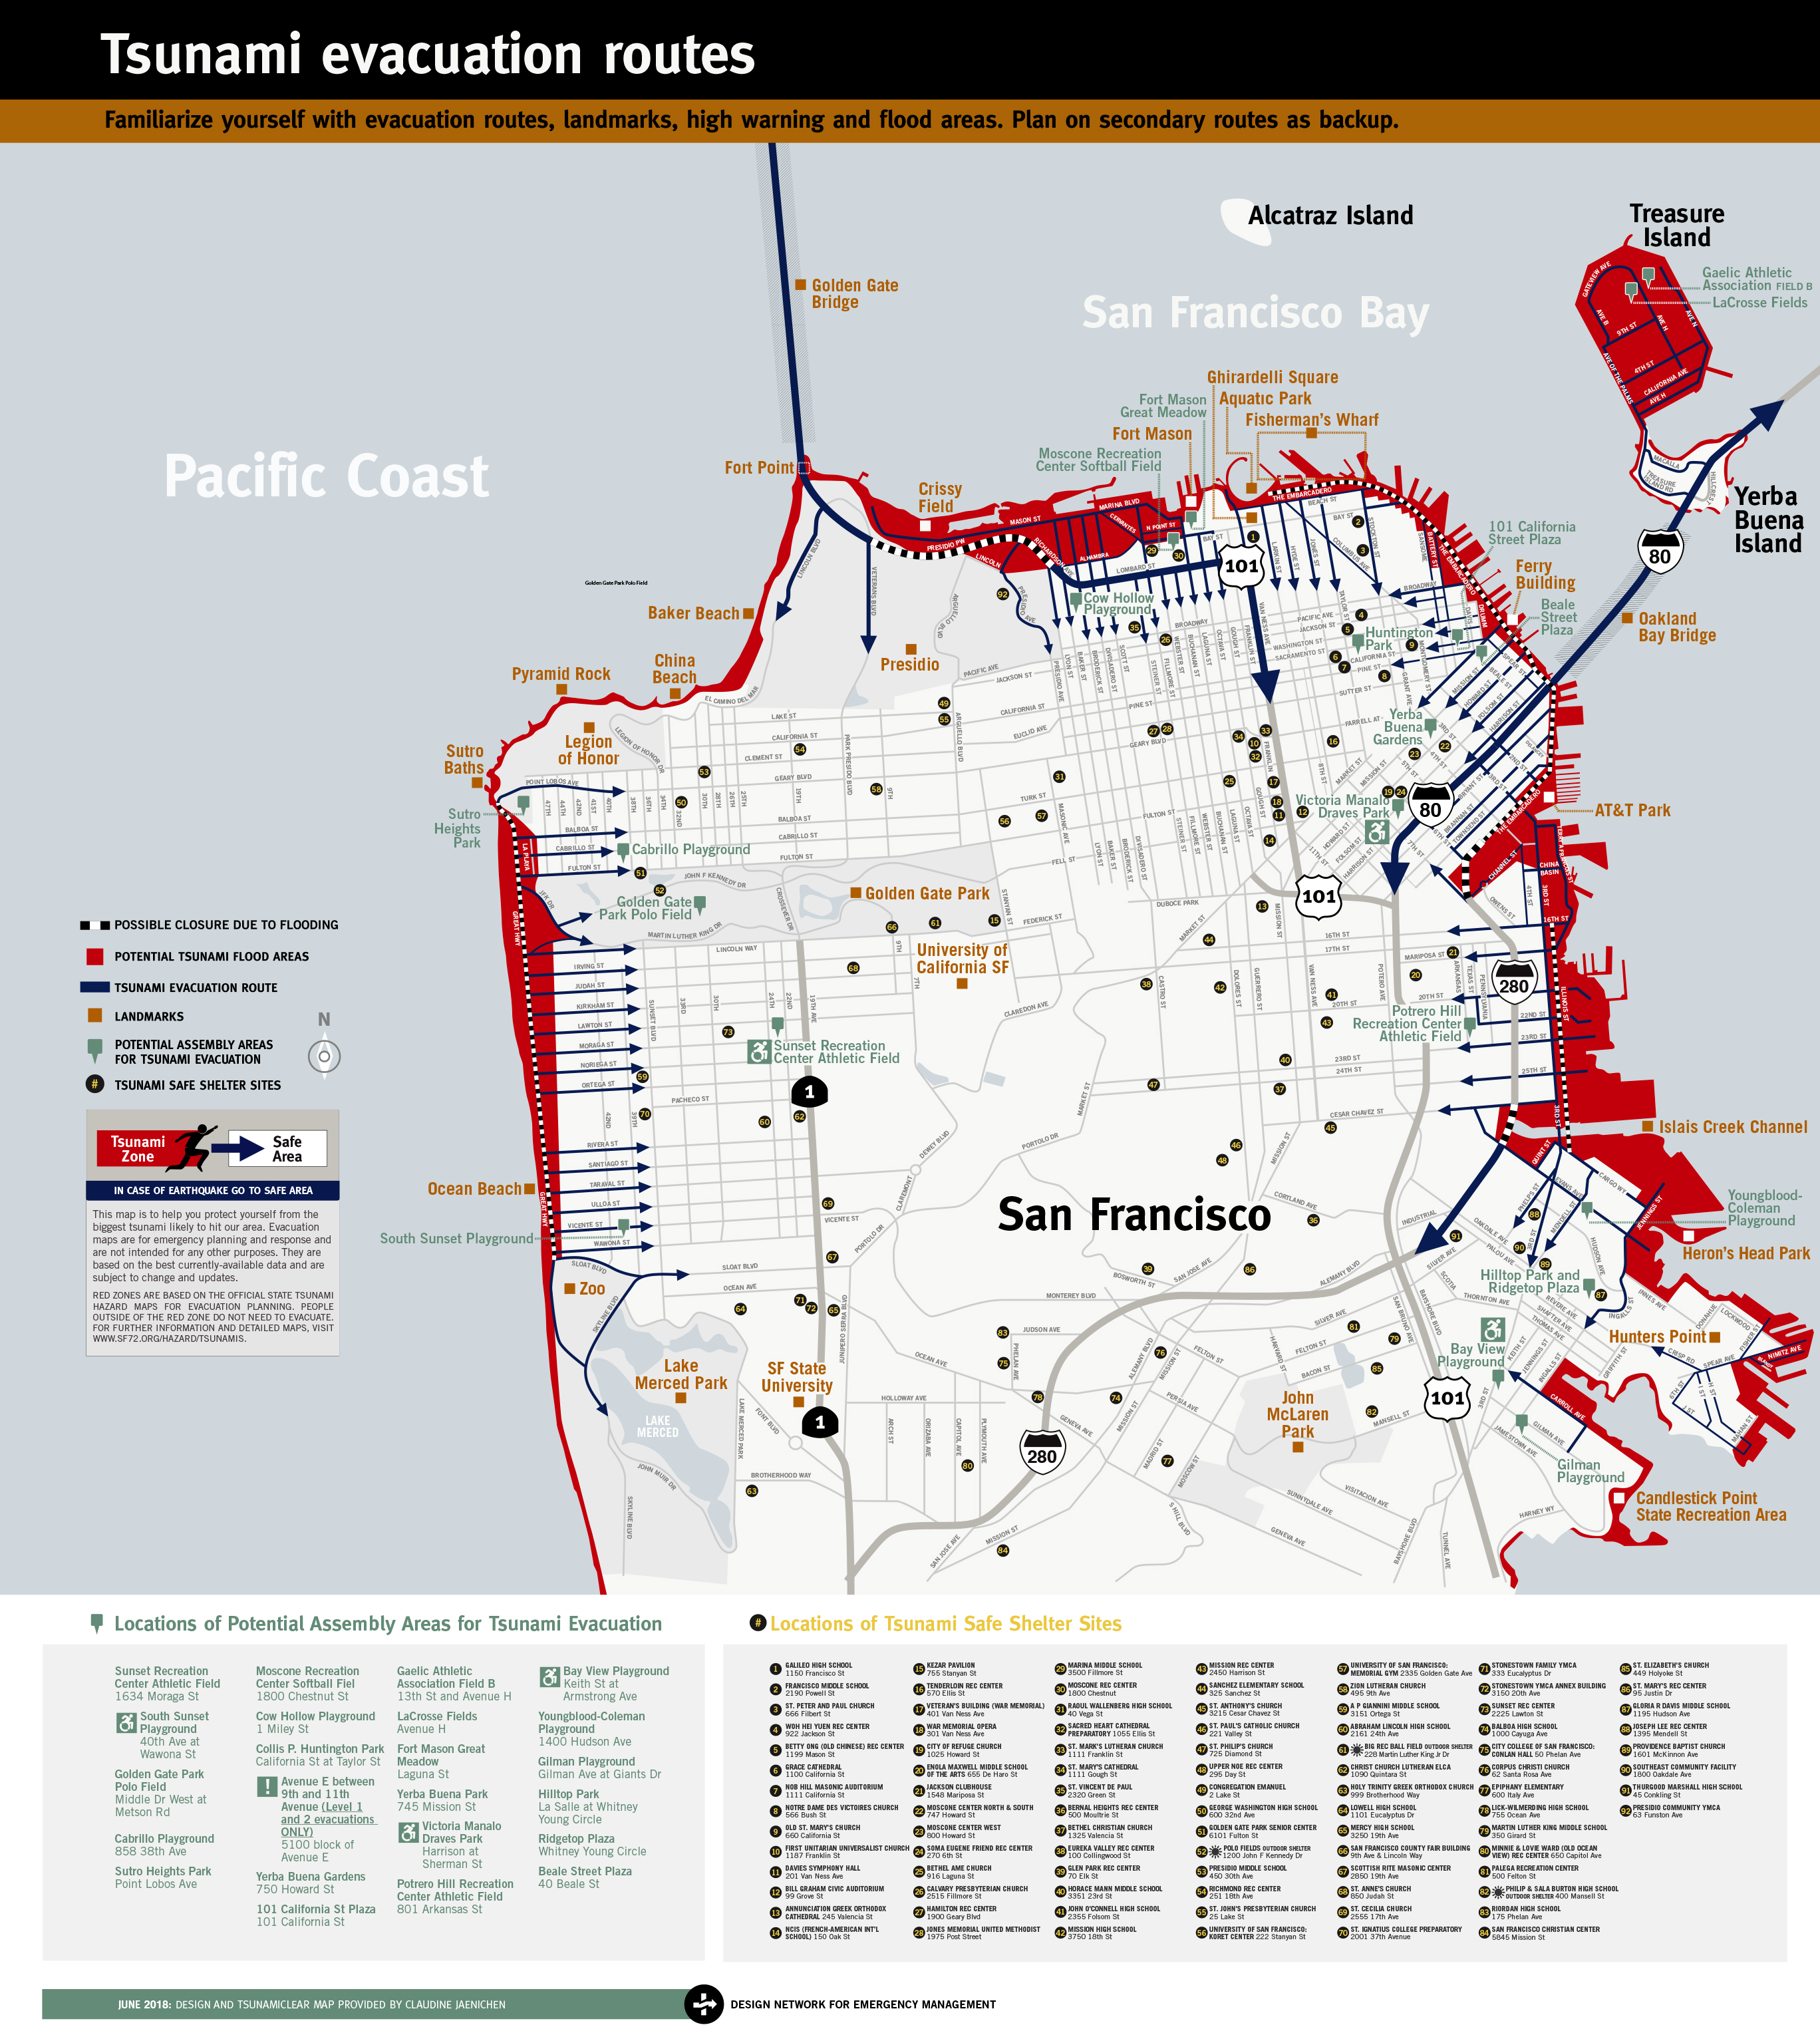
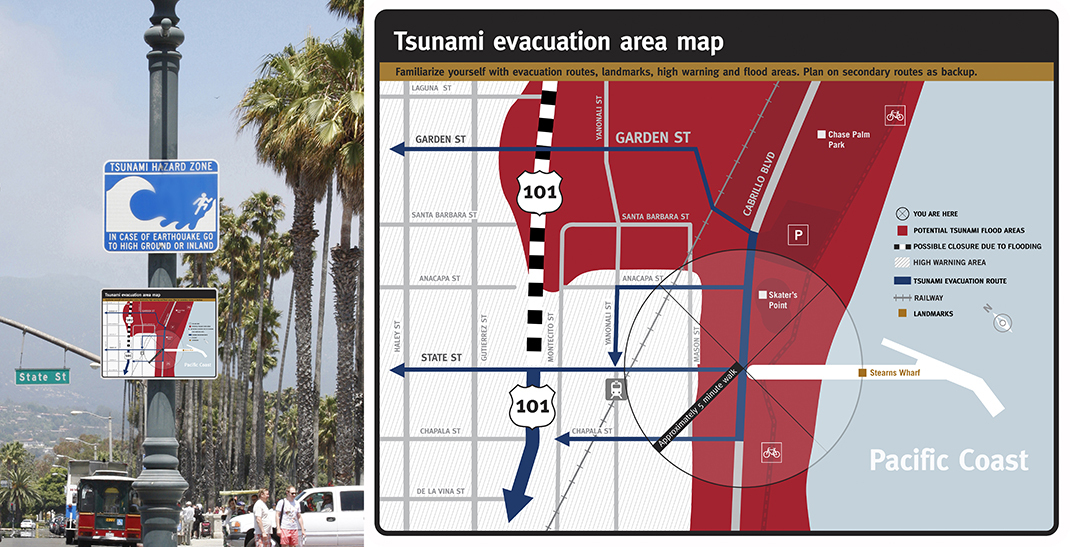
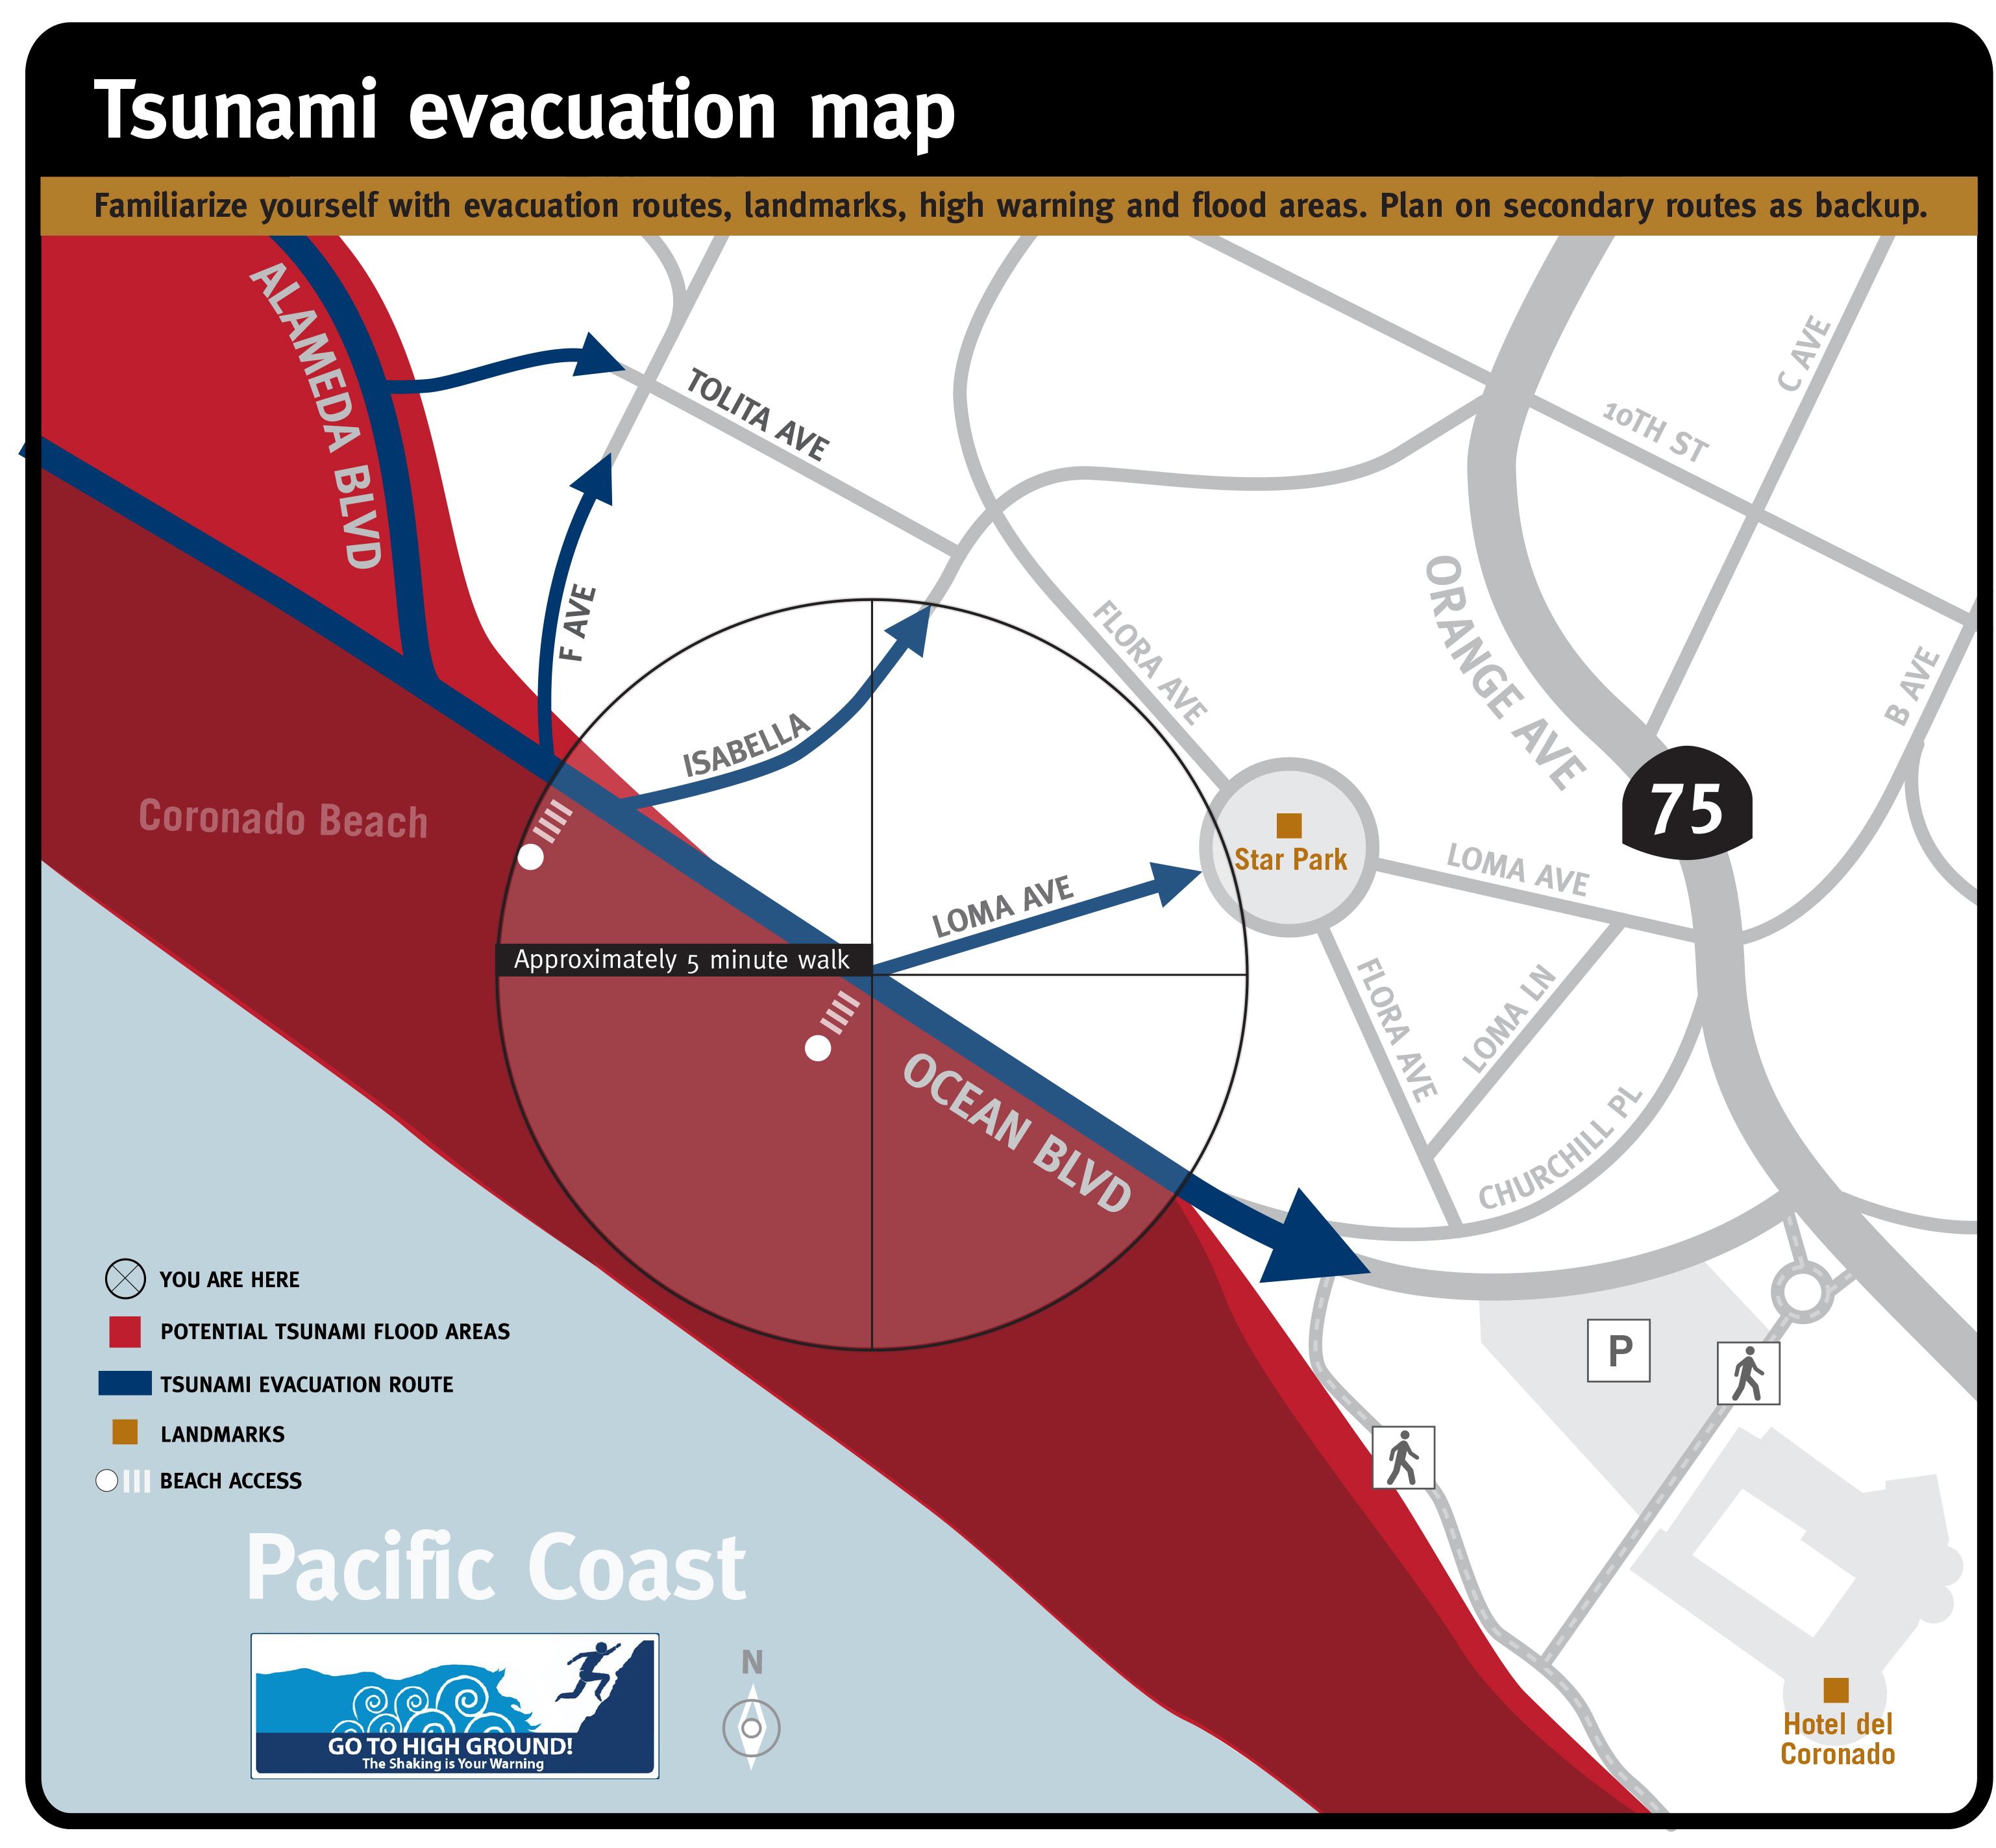
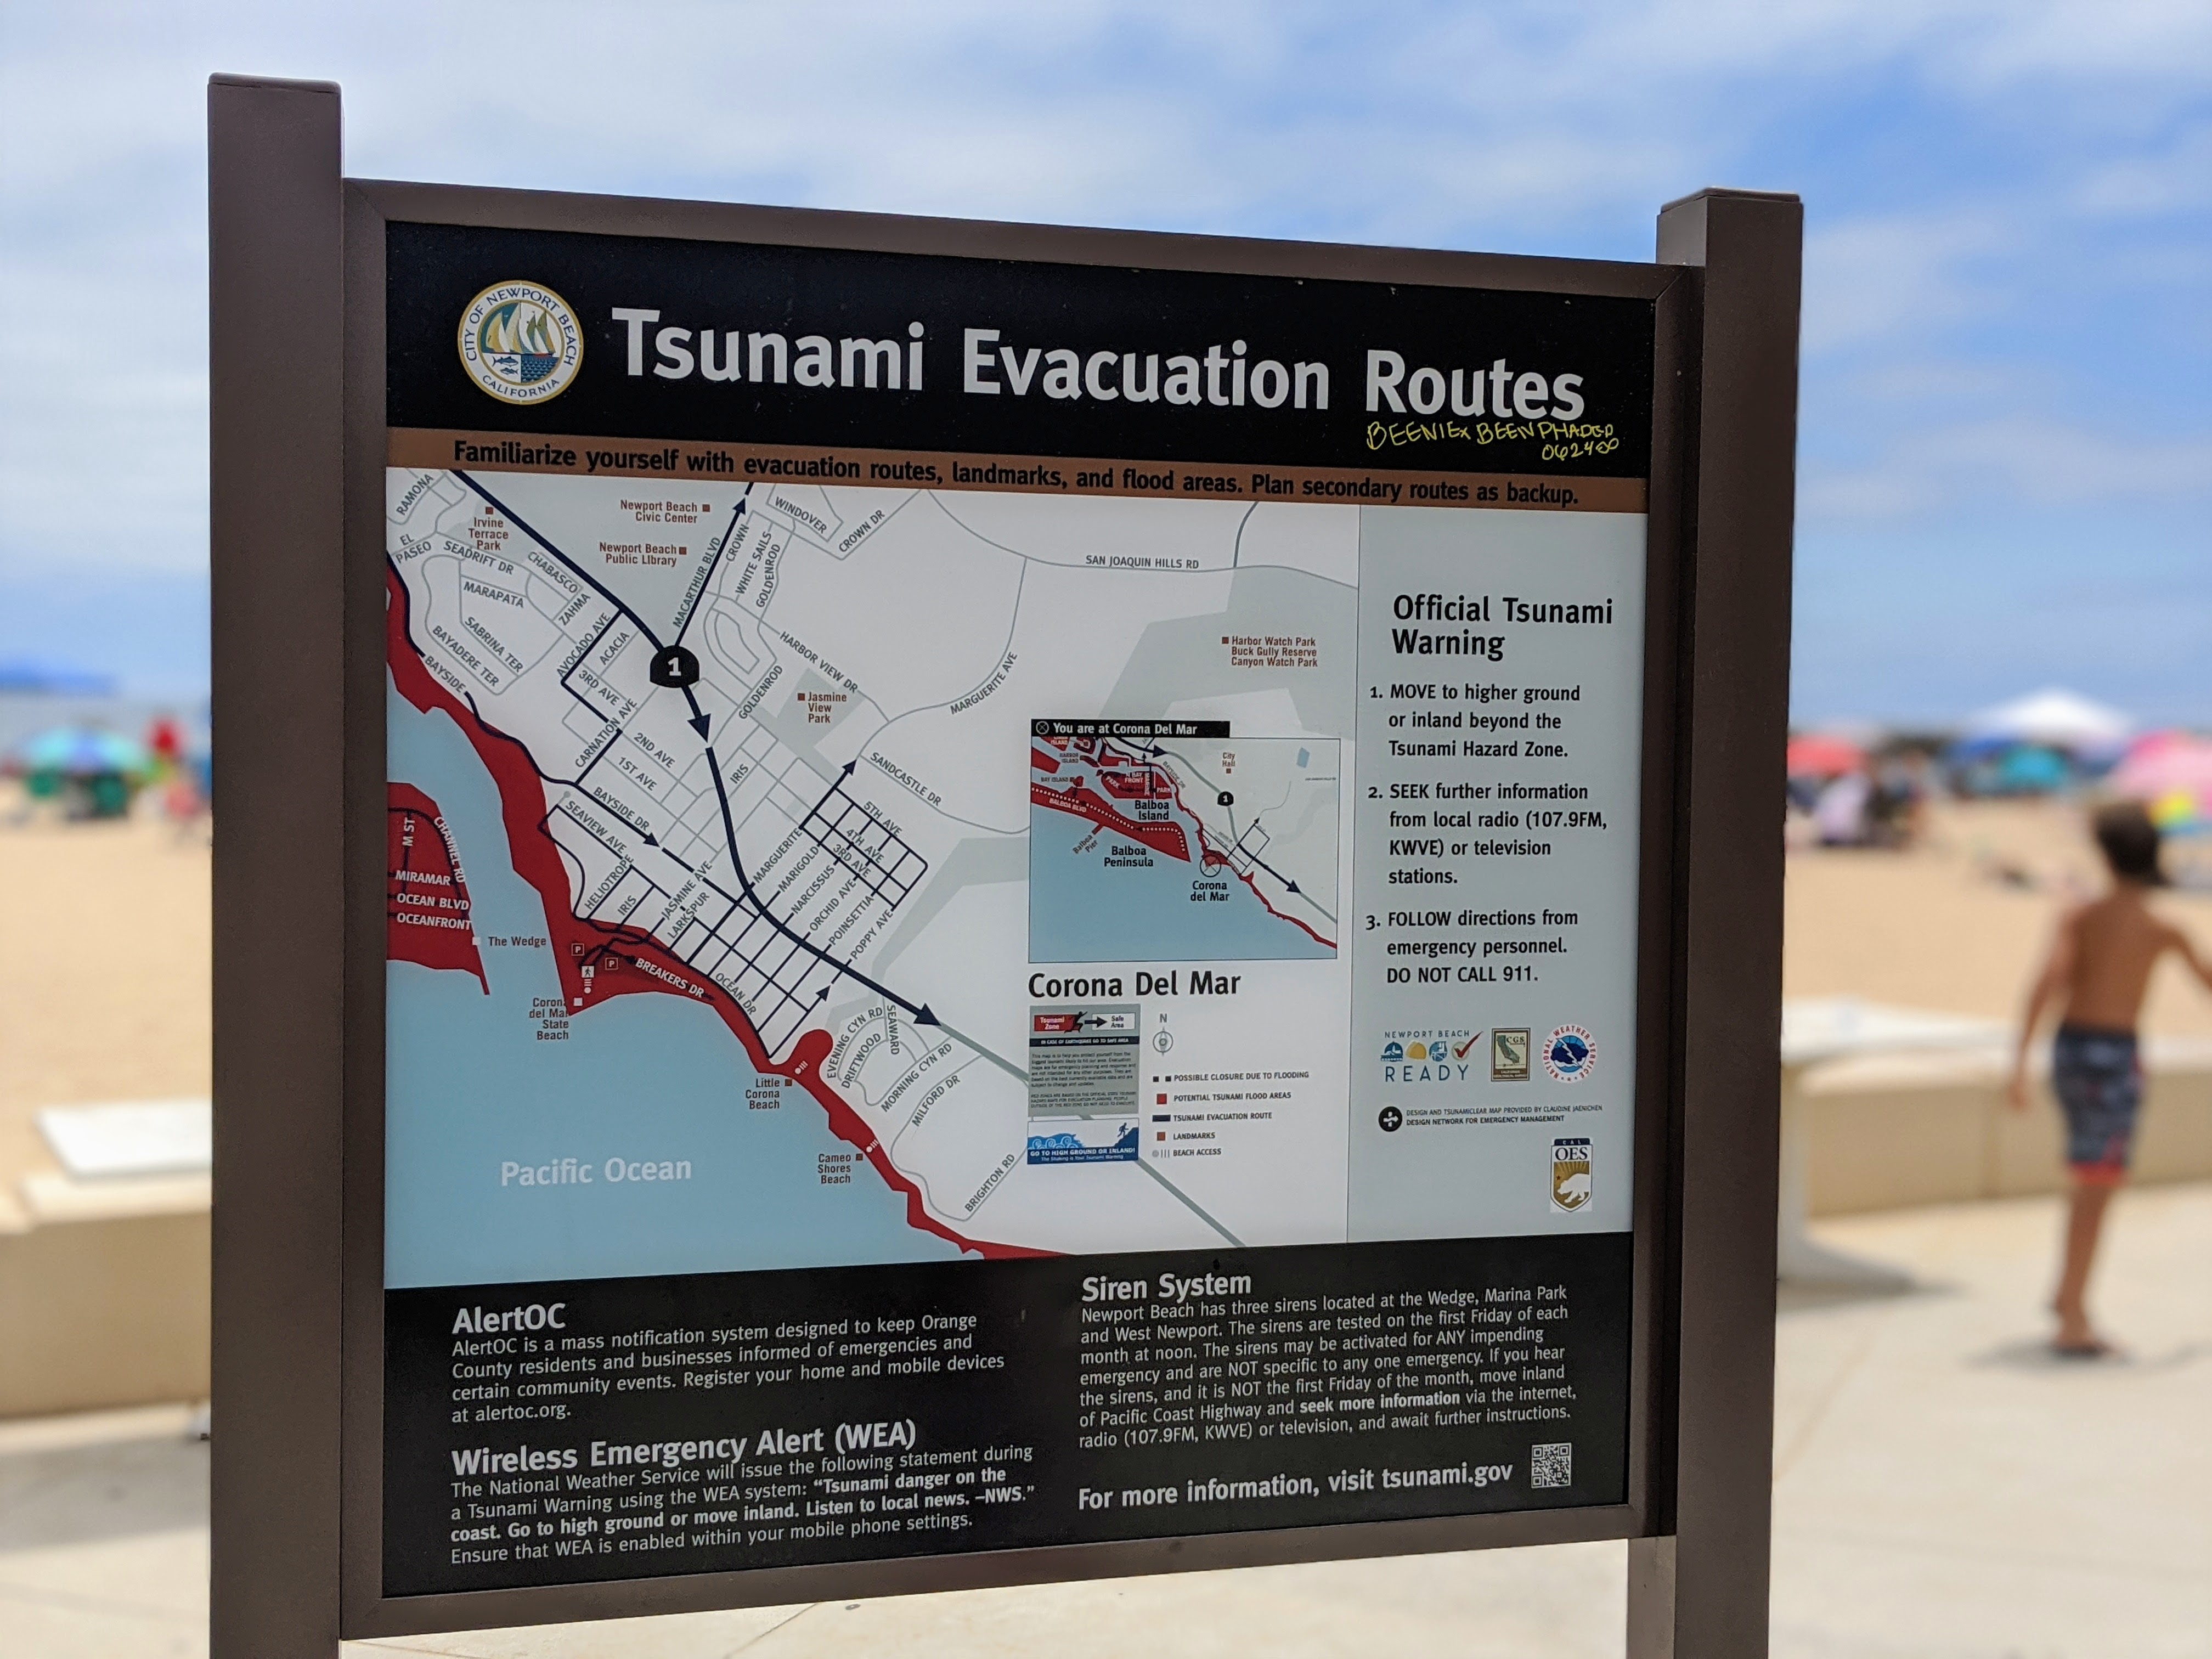
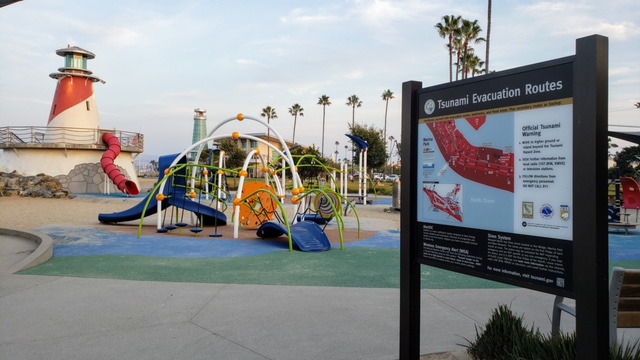
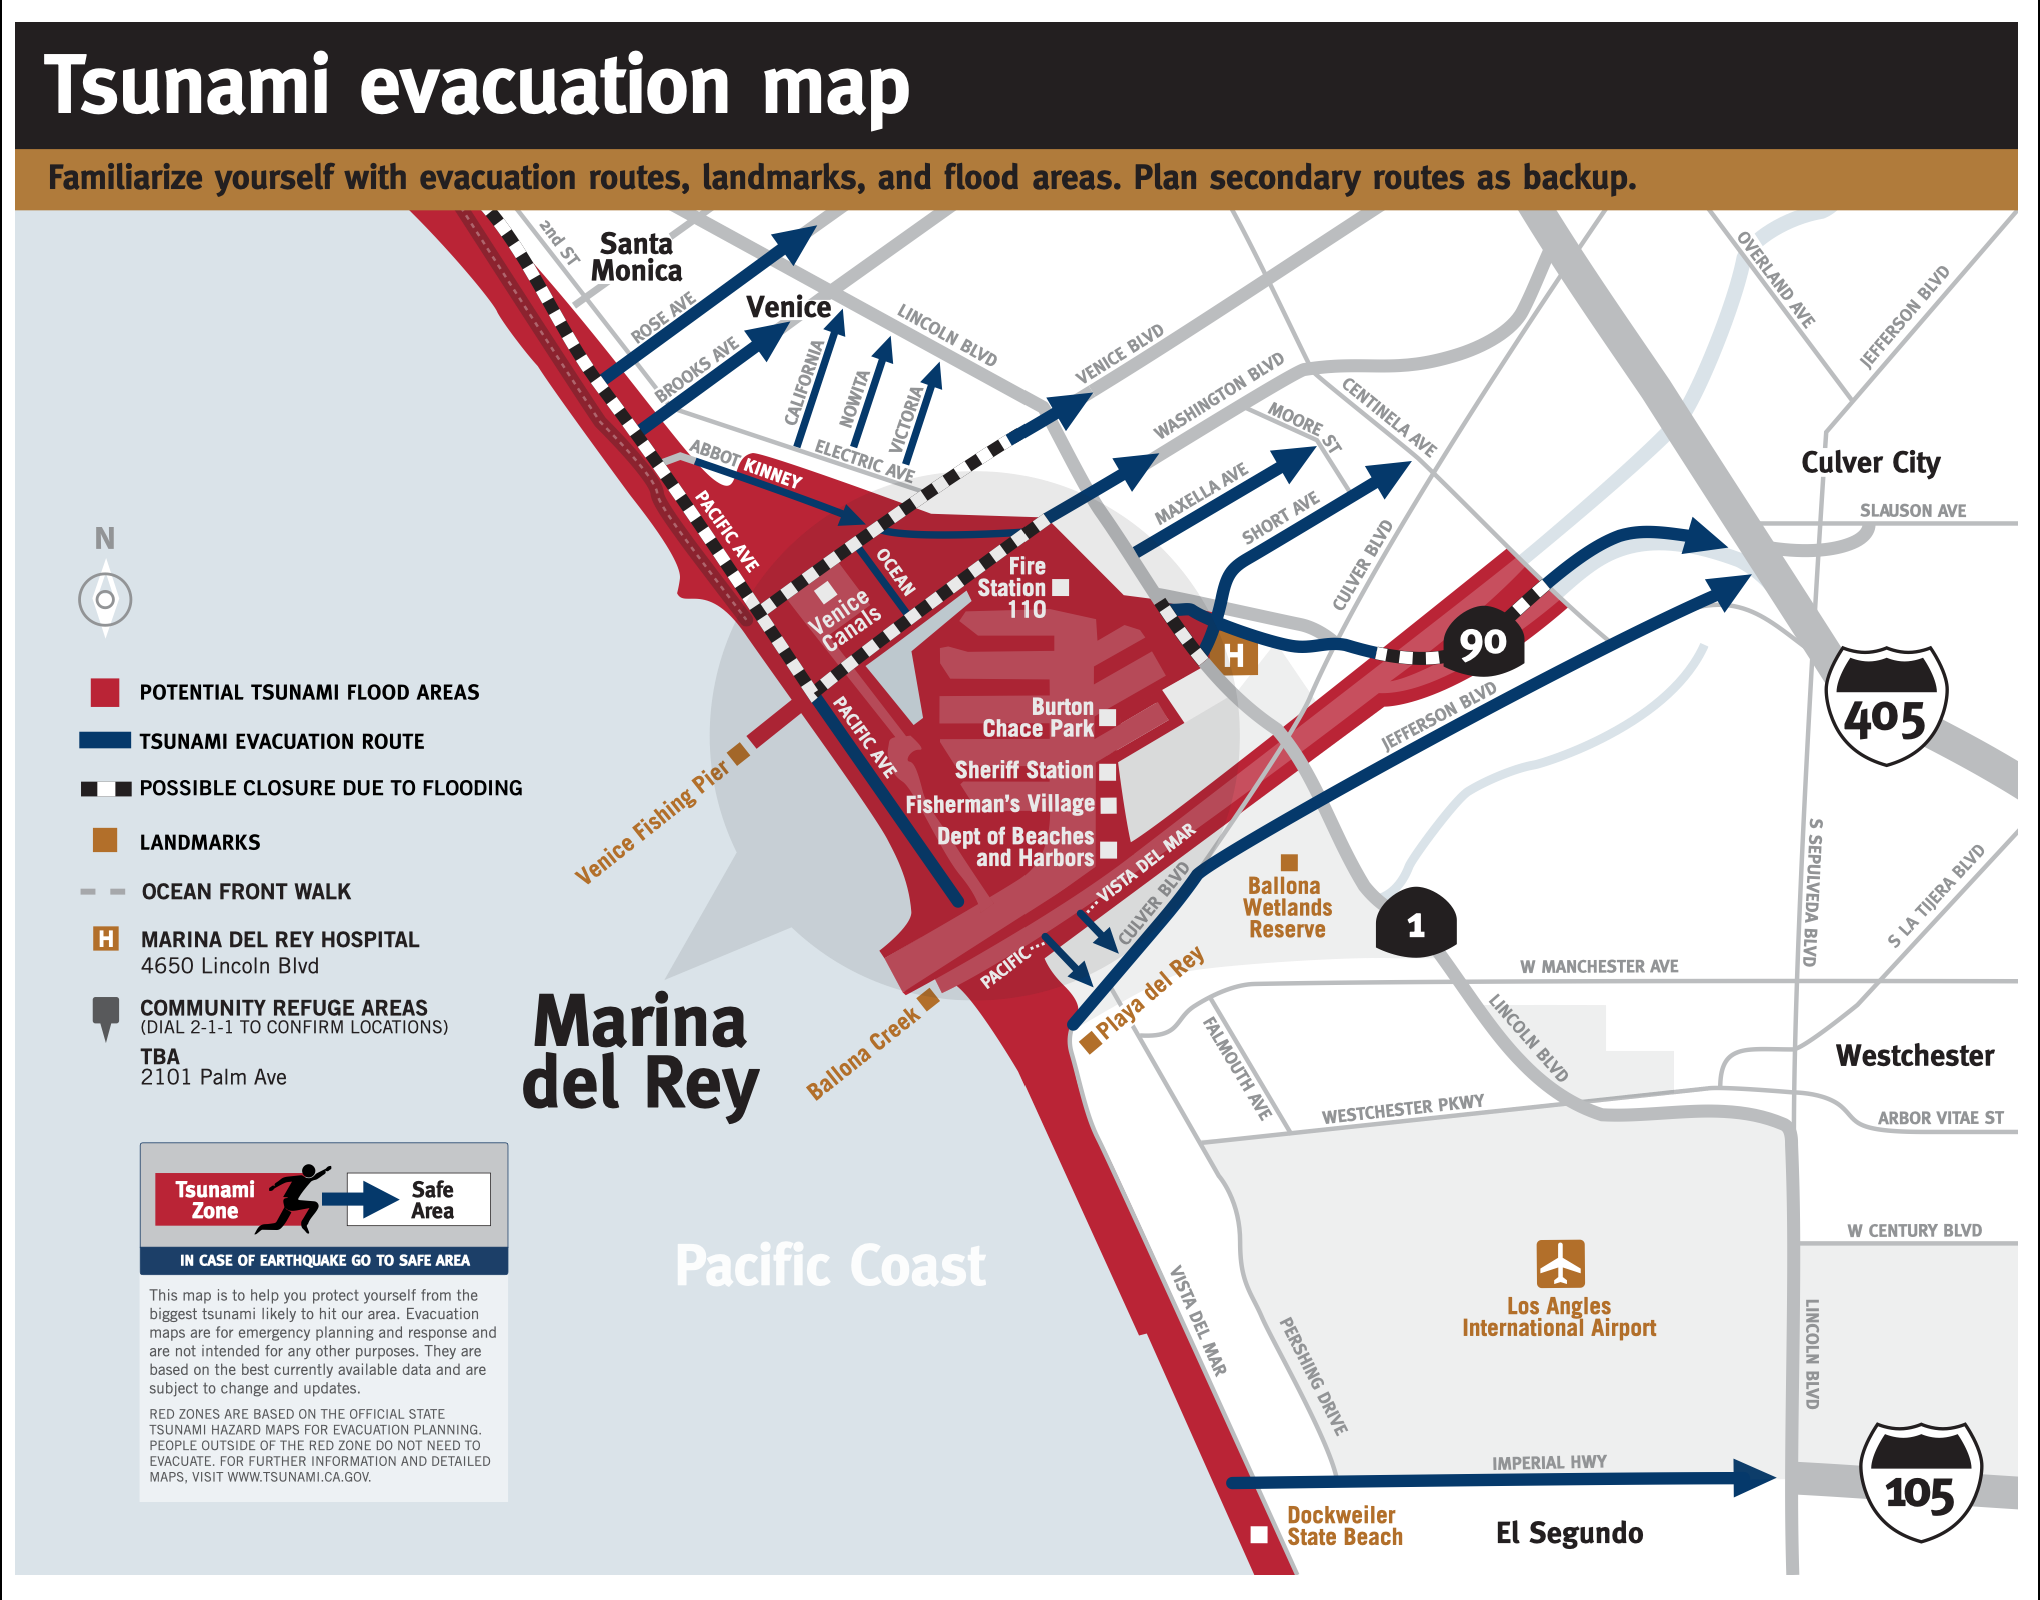
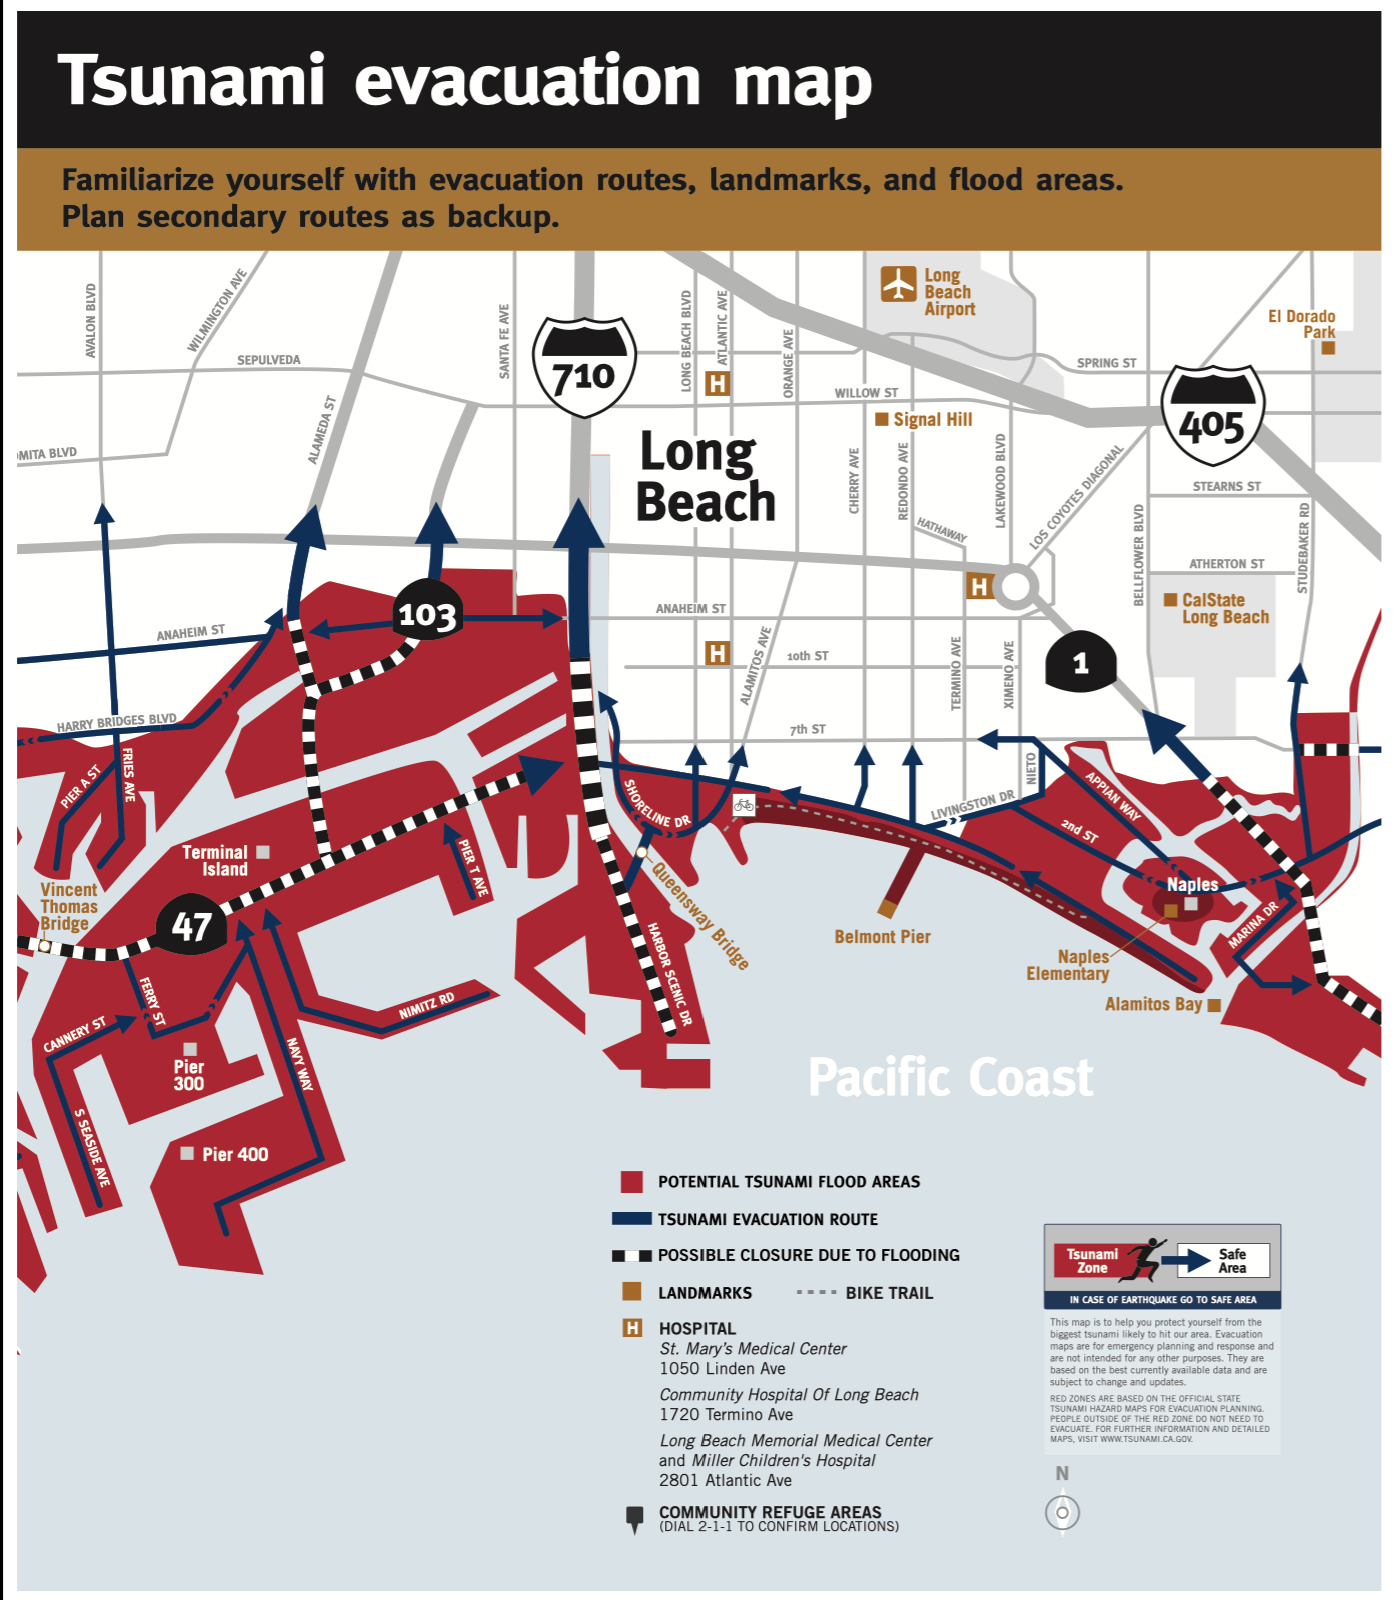
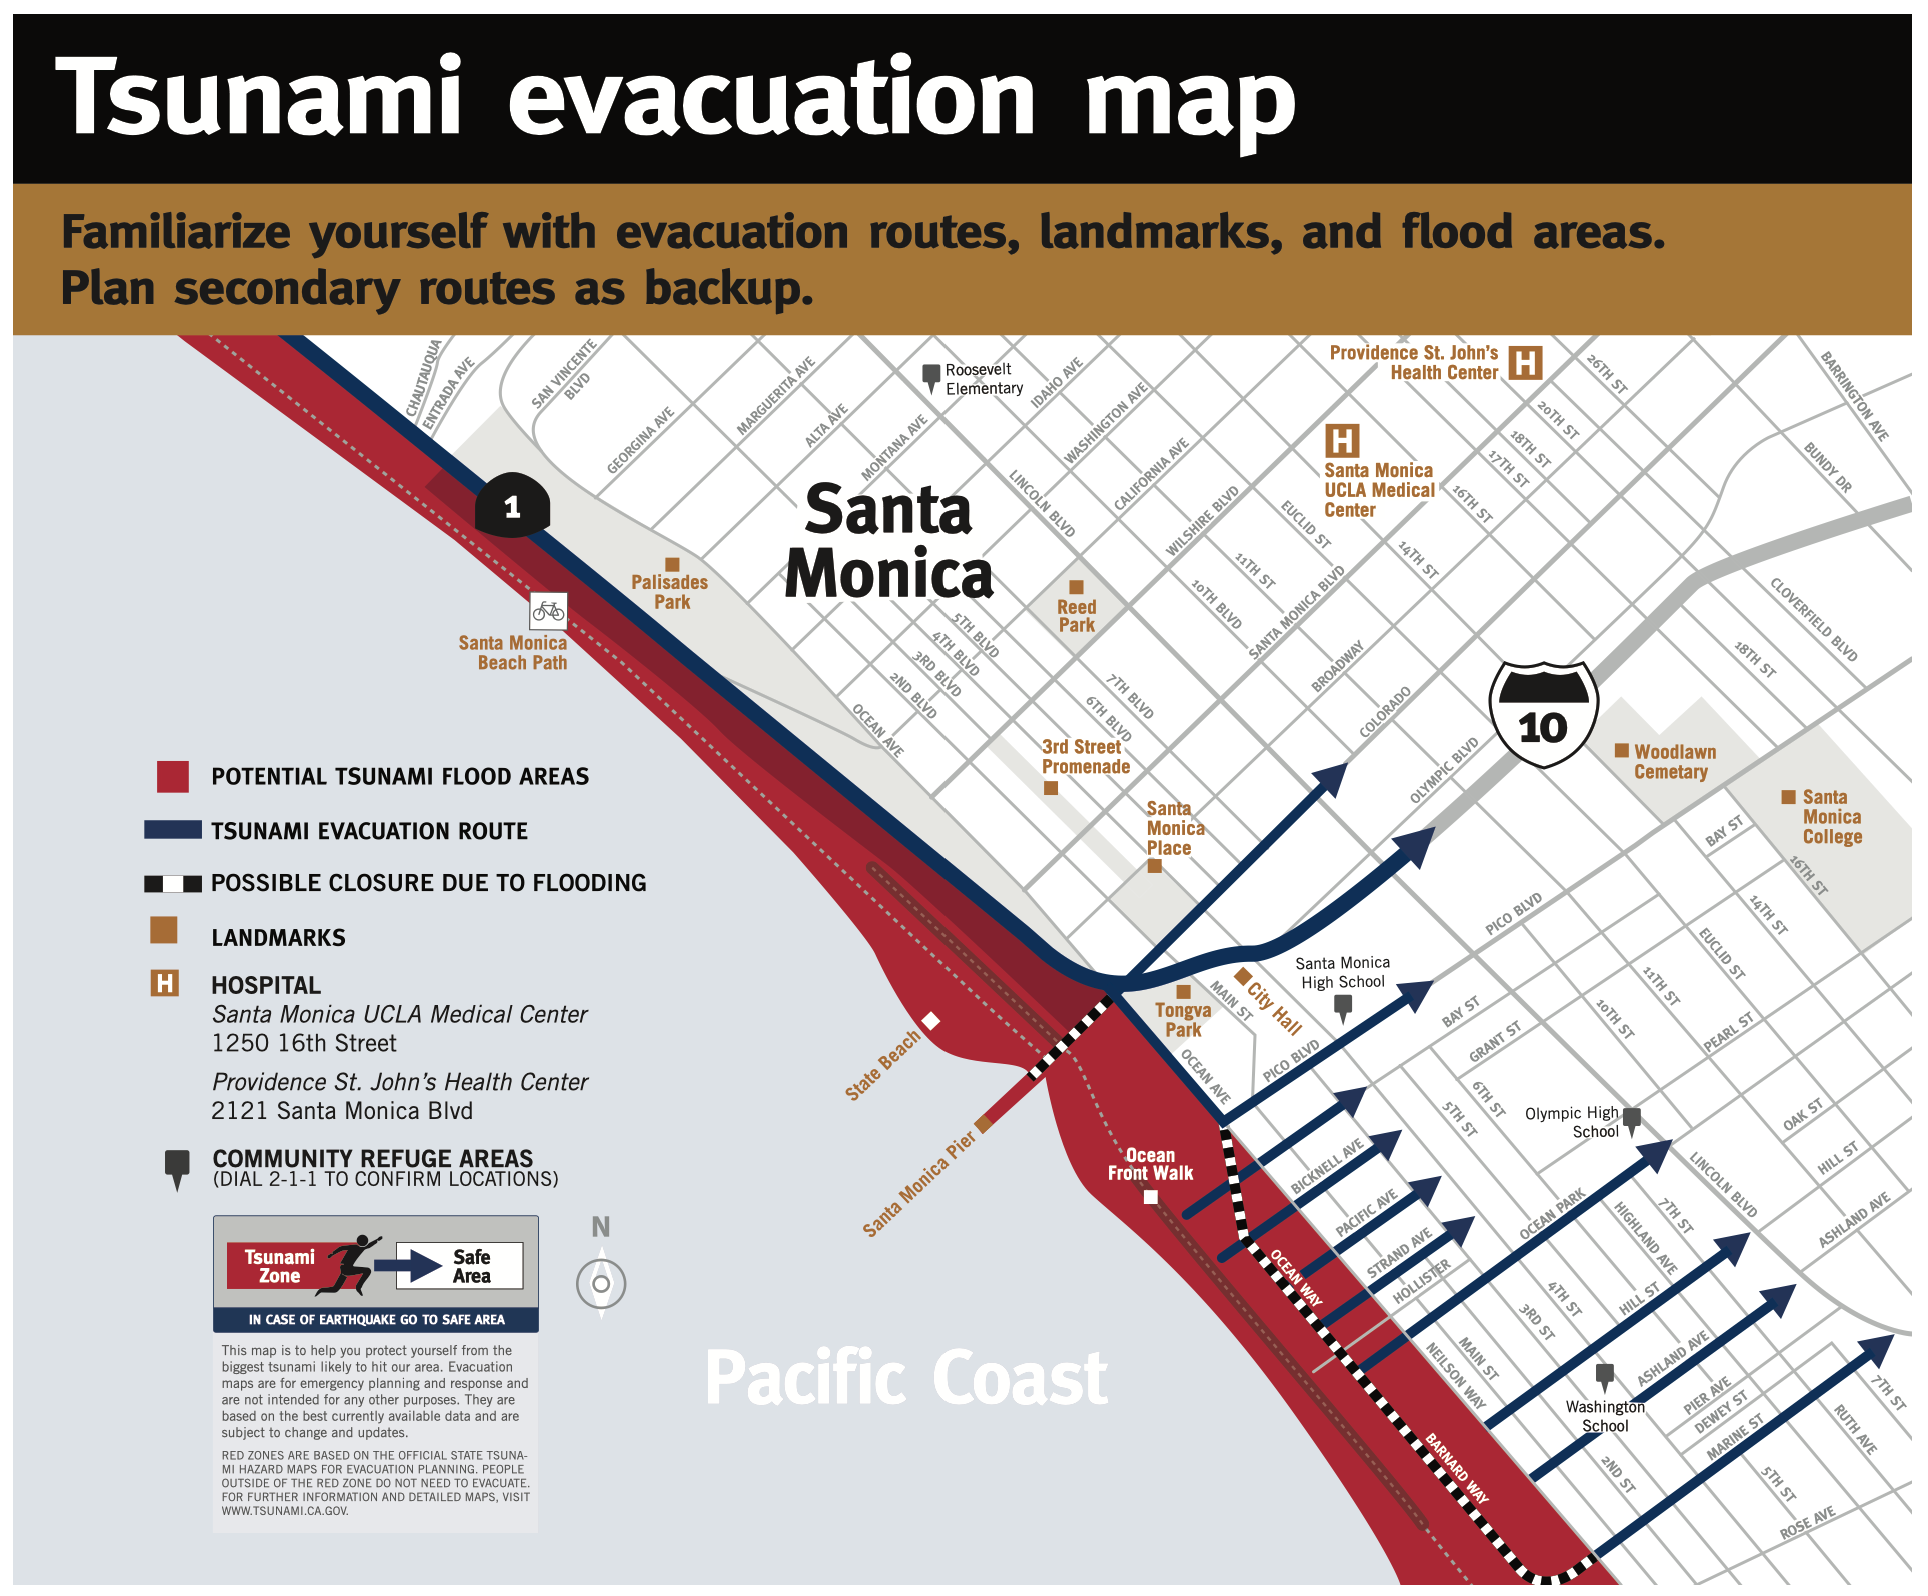
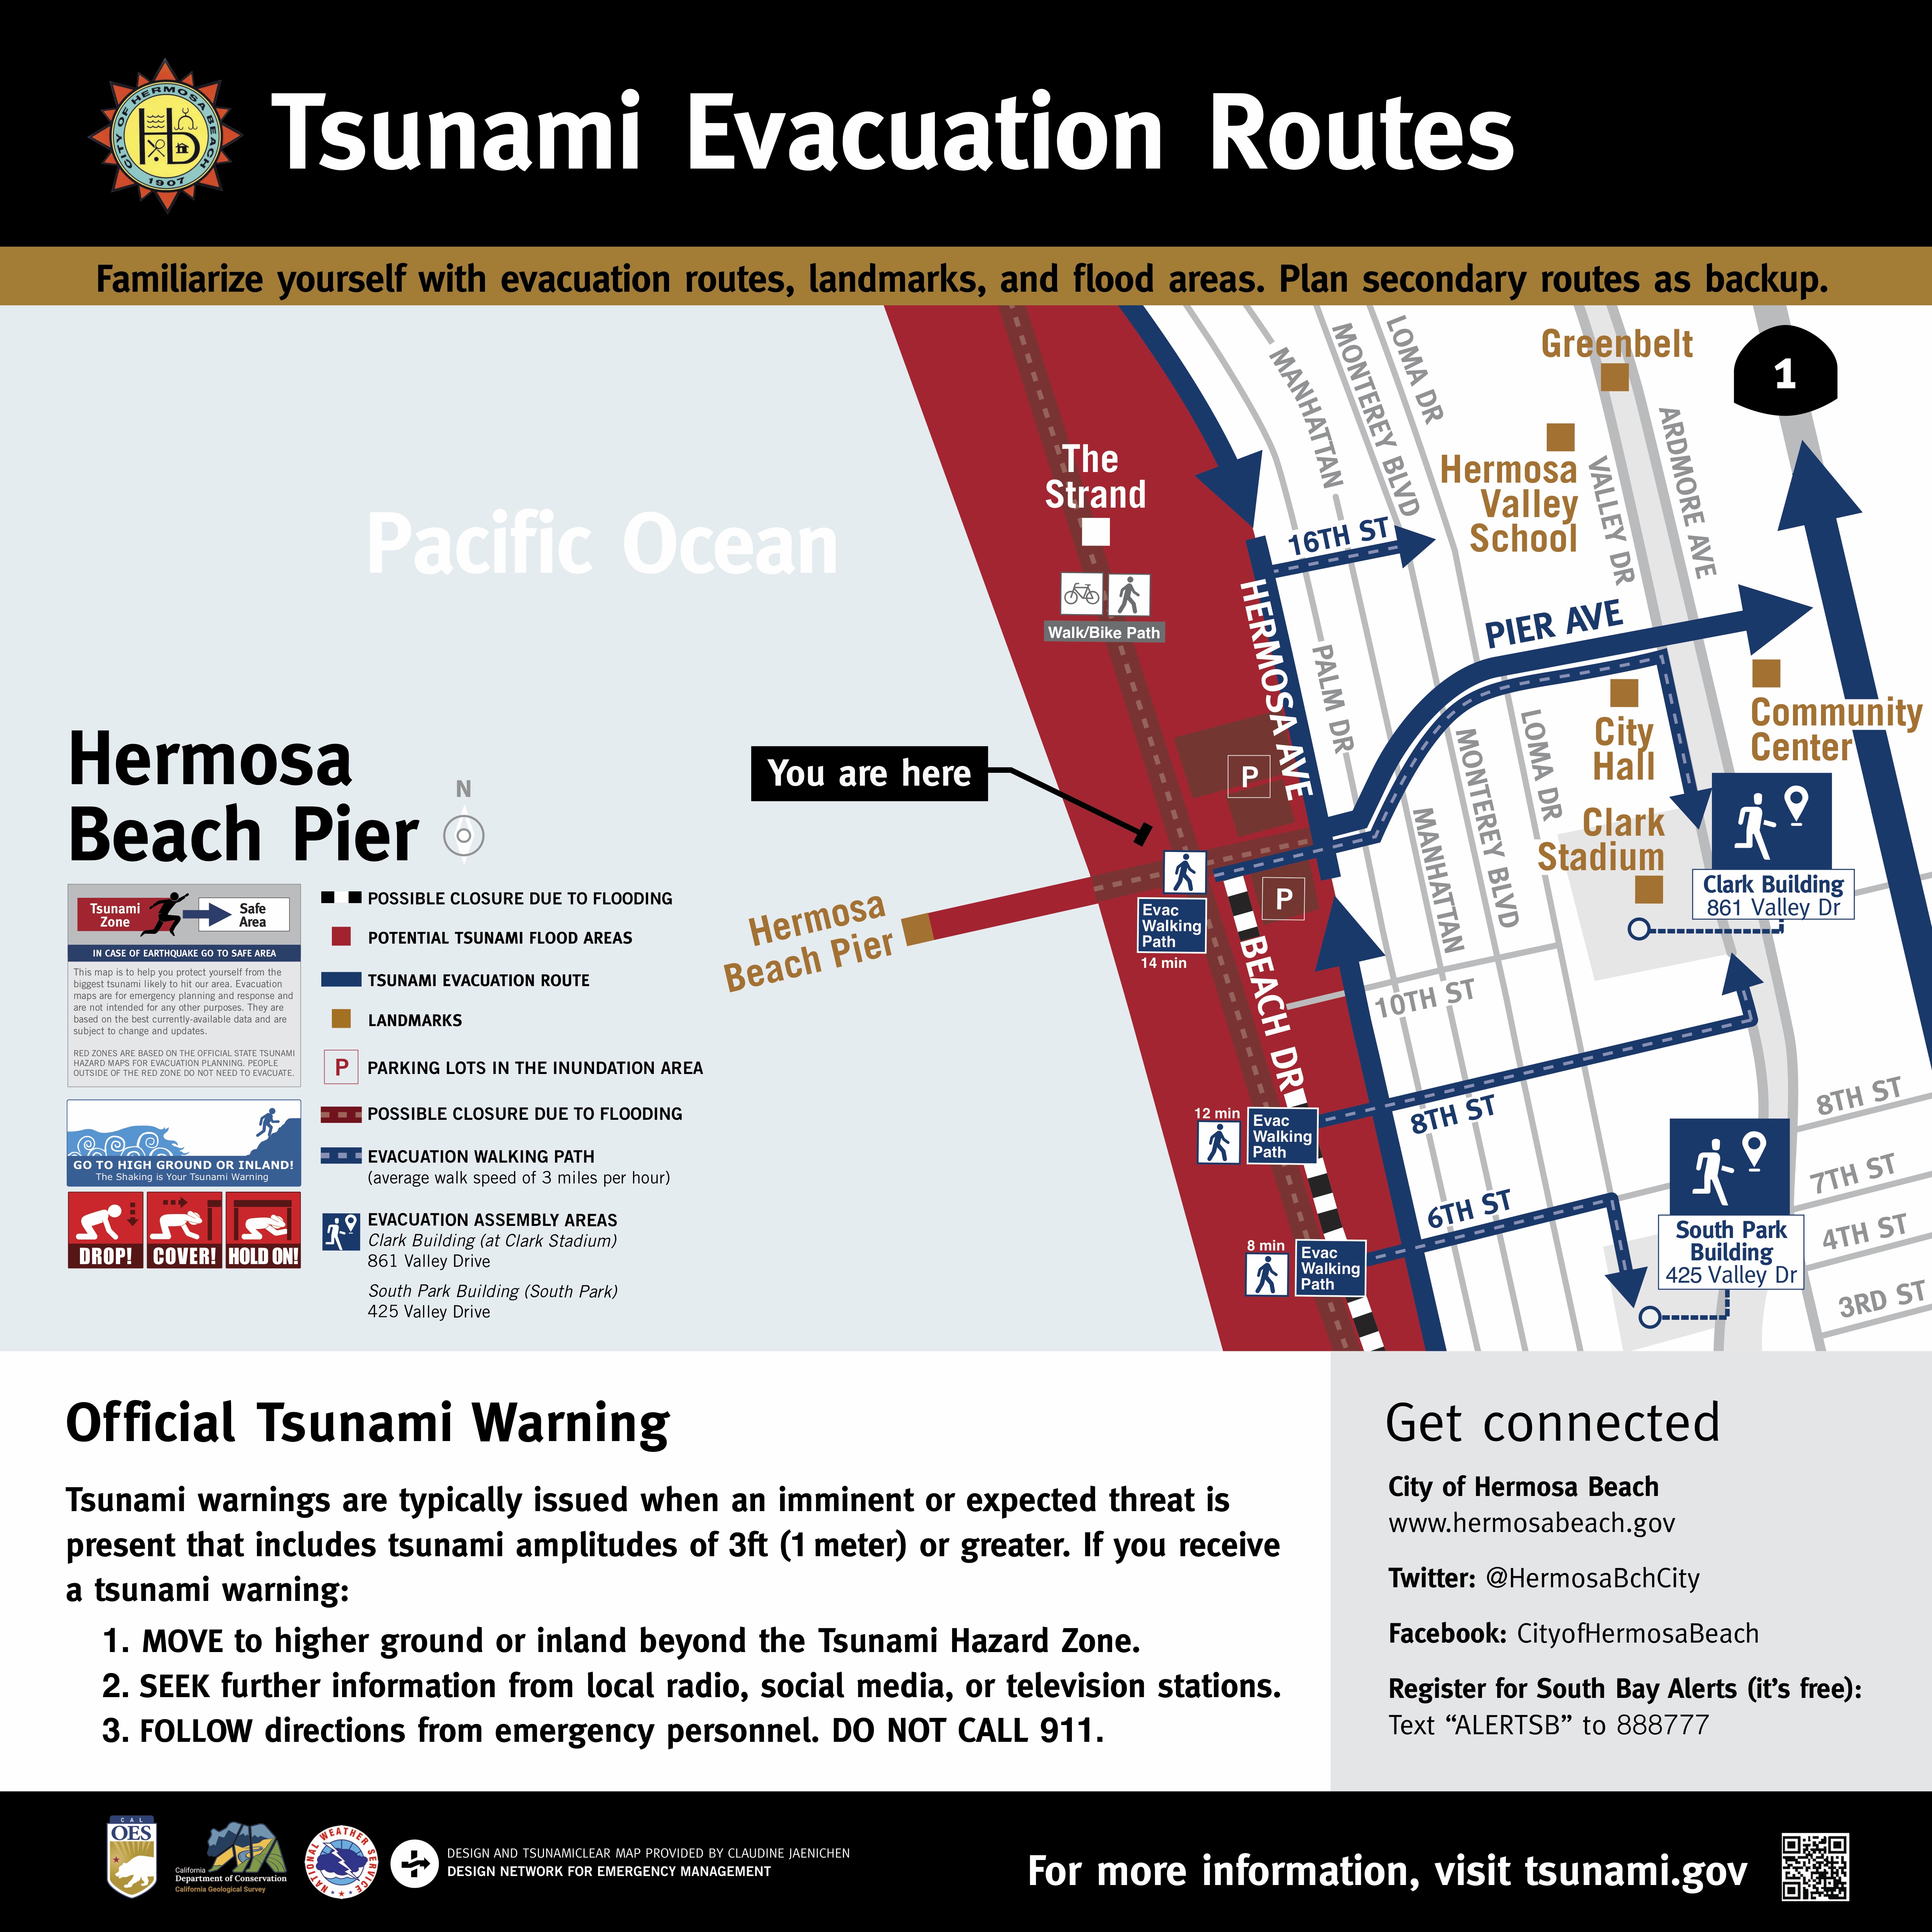
TsunamiClear maps below demonstrate the “branding” of tsunami evacuation information. The “look” of these public-facing maps stay consistent throughout coastal cities in California and does not require the public to learn a new visual language for each city. TsunamiClear maps are also schematic diagrams not based on GIS data. This approach prioritizes relative positions of main landmarks and directional evacuation routes as opposed to geographic accuracy. This concept was adopted from Harry Beck’s London Tube map in 1931 and used widely for public-facing applications such as transportation maps.

TsunamiClear has received recognition, awards and published in several academic journals and design publications including Kim Bear’s Information Design Workbook, Revised and Updated (2021), Per Mollerup’s Wayshowing > Wayfinding II: Basic and Interactive (2013) and 2+3d Grafika Plus Produkt (Polish Design Quarterly) Issue 52. NR15 (11/2014):13 ISSN 1642-7602. TsunamiClear received the California Emergency Services Association’s Silver Award for the TsunamiClear campaign in San Diego County.


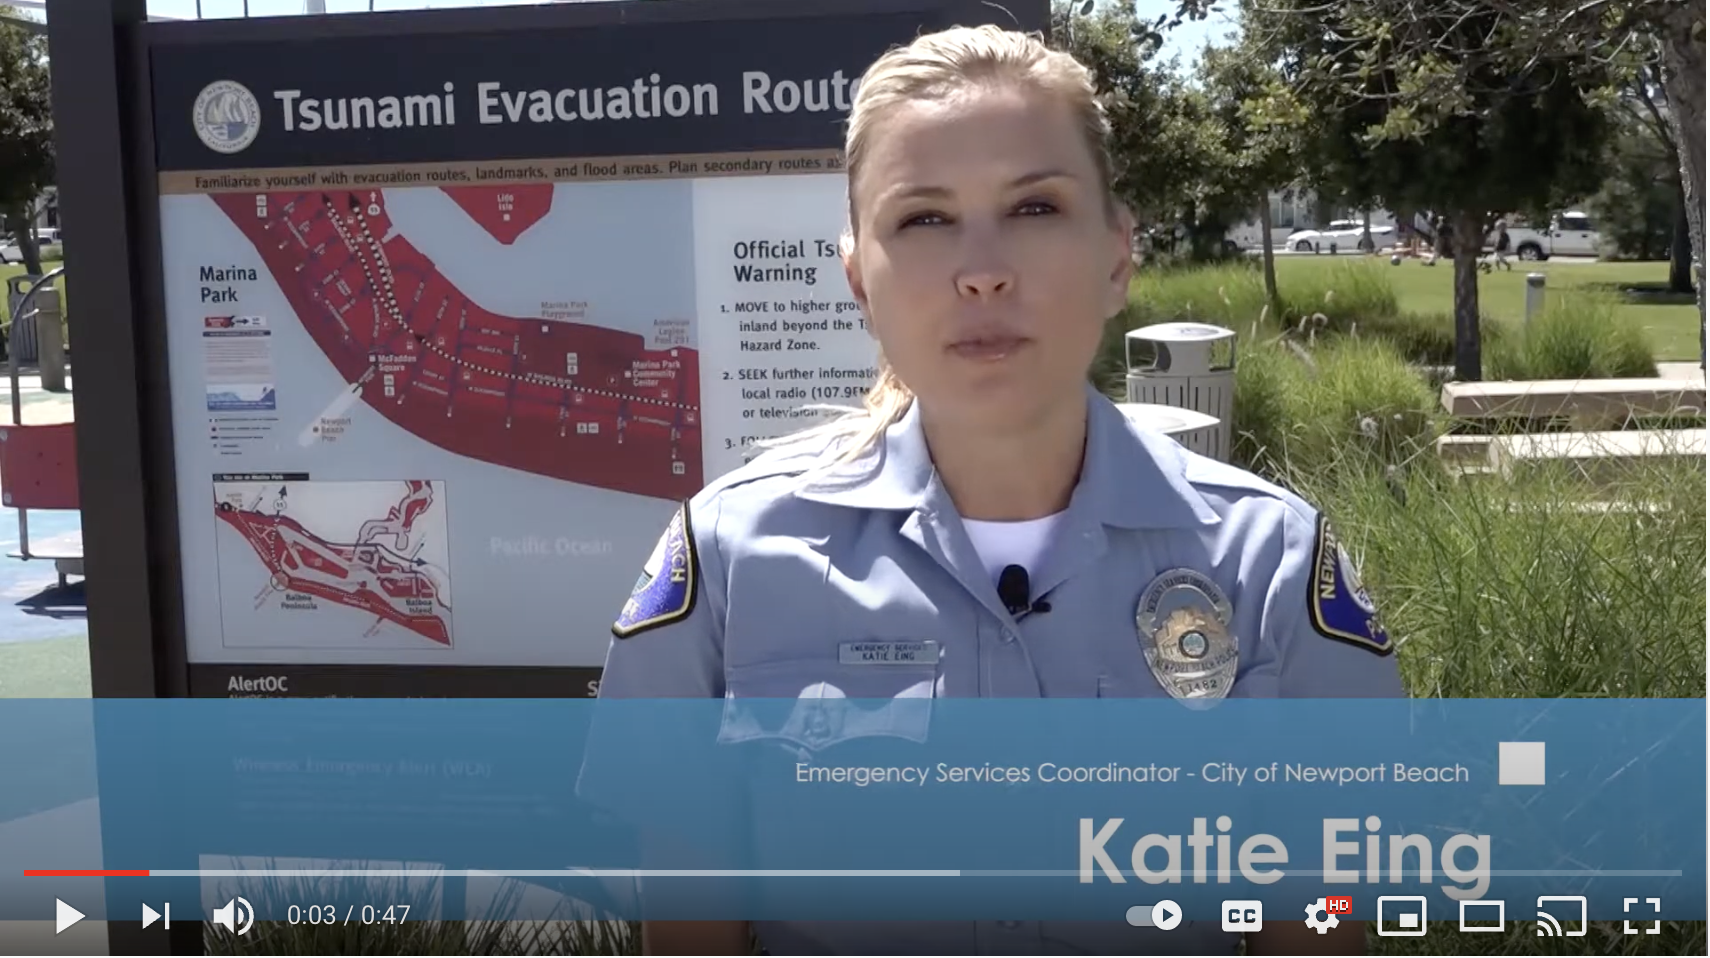
The City of Newport Beach Emergency Services Coordinator, Katie Eing, shares a video of the TsunamiClear Maps created for the city and the importance of knowing your tsunami evacuation route.
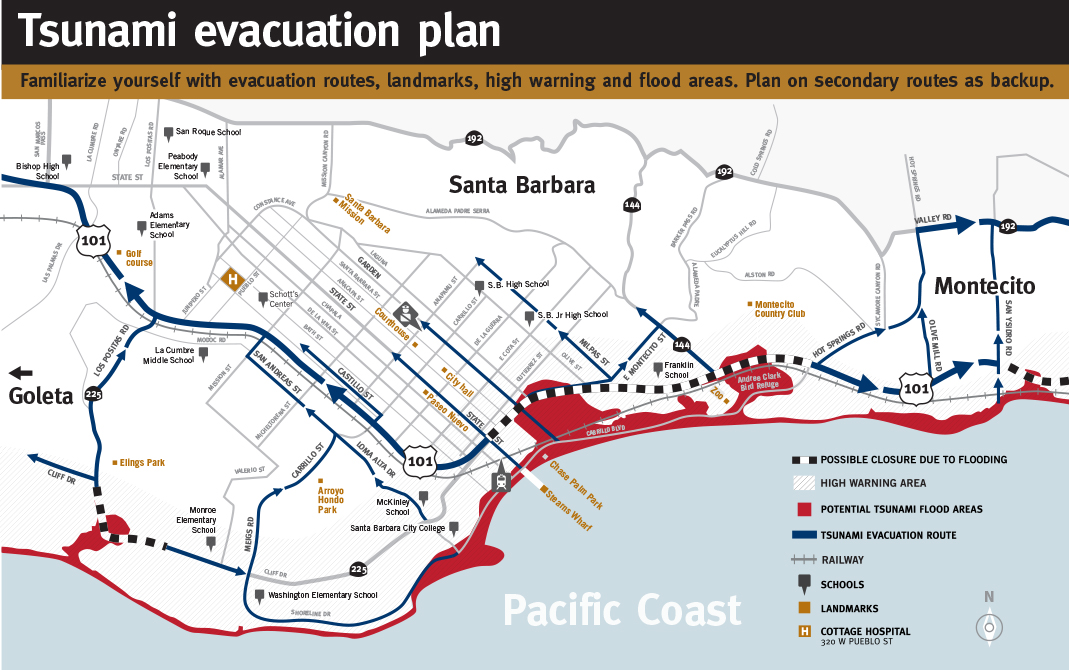
Santa Barbara
Santa Barbara was the first pilot city to apply TsunamiClear visual standards and provided the platform to run the cognitive recall study with Chapman University.
Disclaimer: Tsunami information and inundation area is reviewed and revised regularly by CalOES and CGS. The maps below do not reflect the most recent and updated changes. Please do not refer to these maps in an emergency situation. Refer to your local emergency management department in your city for updates.

San Diego County
Here are a few samples of TsunamiClear campaign for San Diego County. It was the first full-county rollout supported which gained some media attention.
Disclaimer: Tsunami information and inundation area is reviewed and revised regularly by CalOES and CGS. The maps below do not reflect the most recent and updated changes. Please do not refer to these maps in an emergency situation. Refer to your local emergency management department in your city for updates.

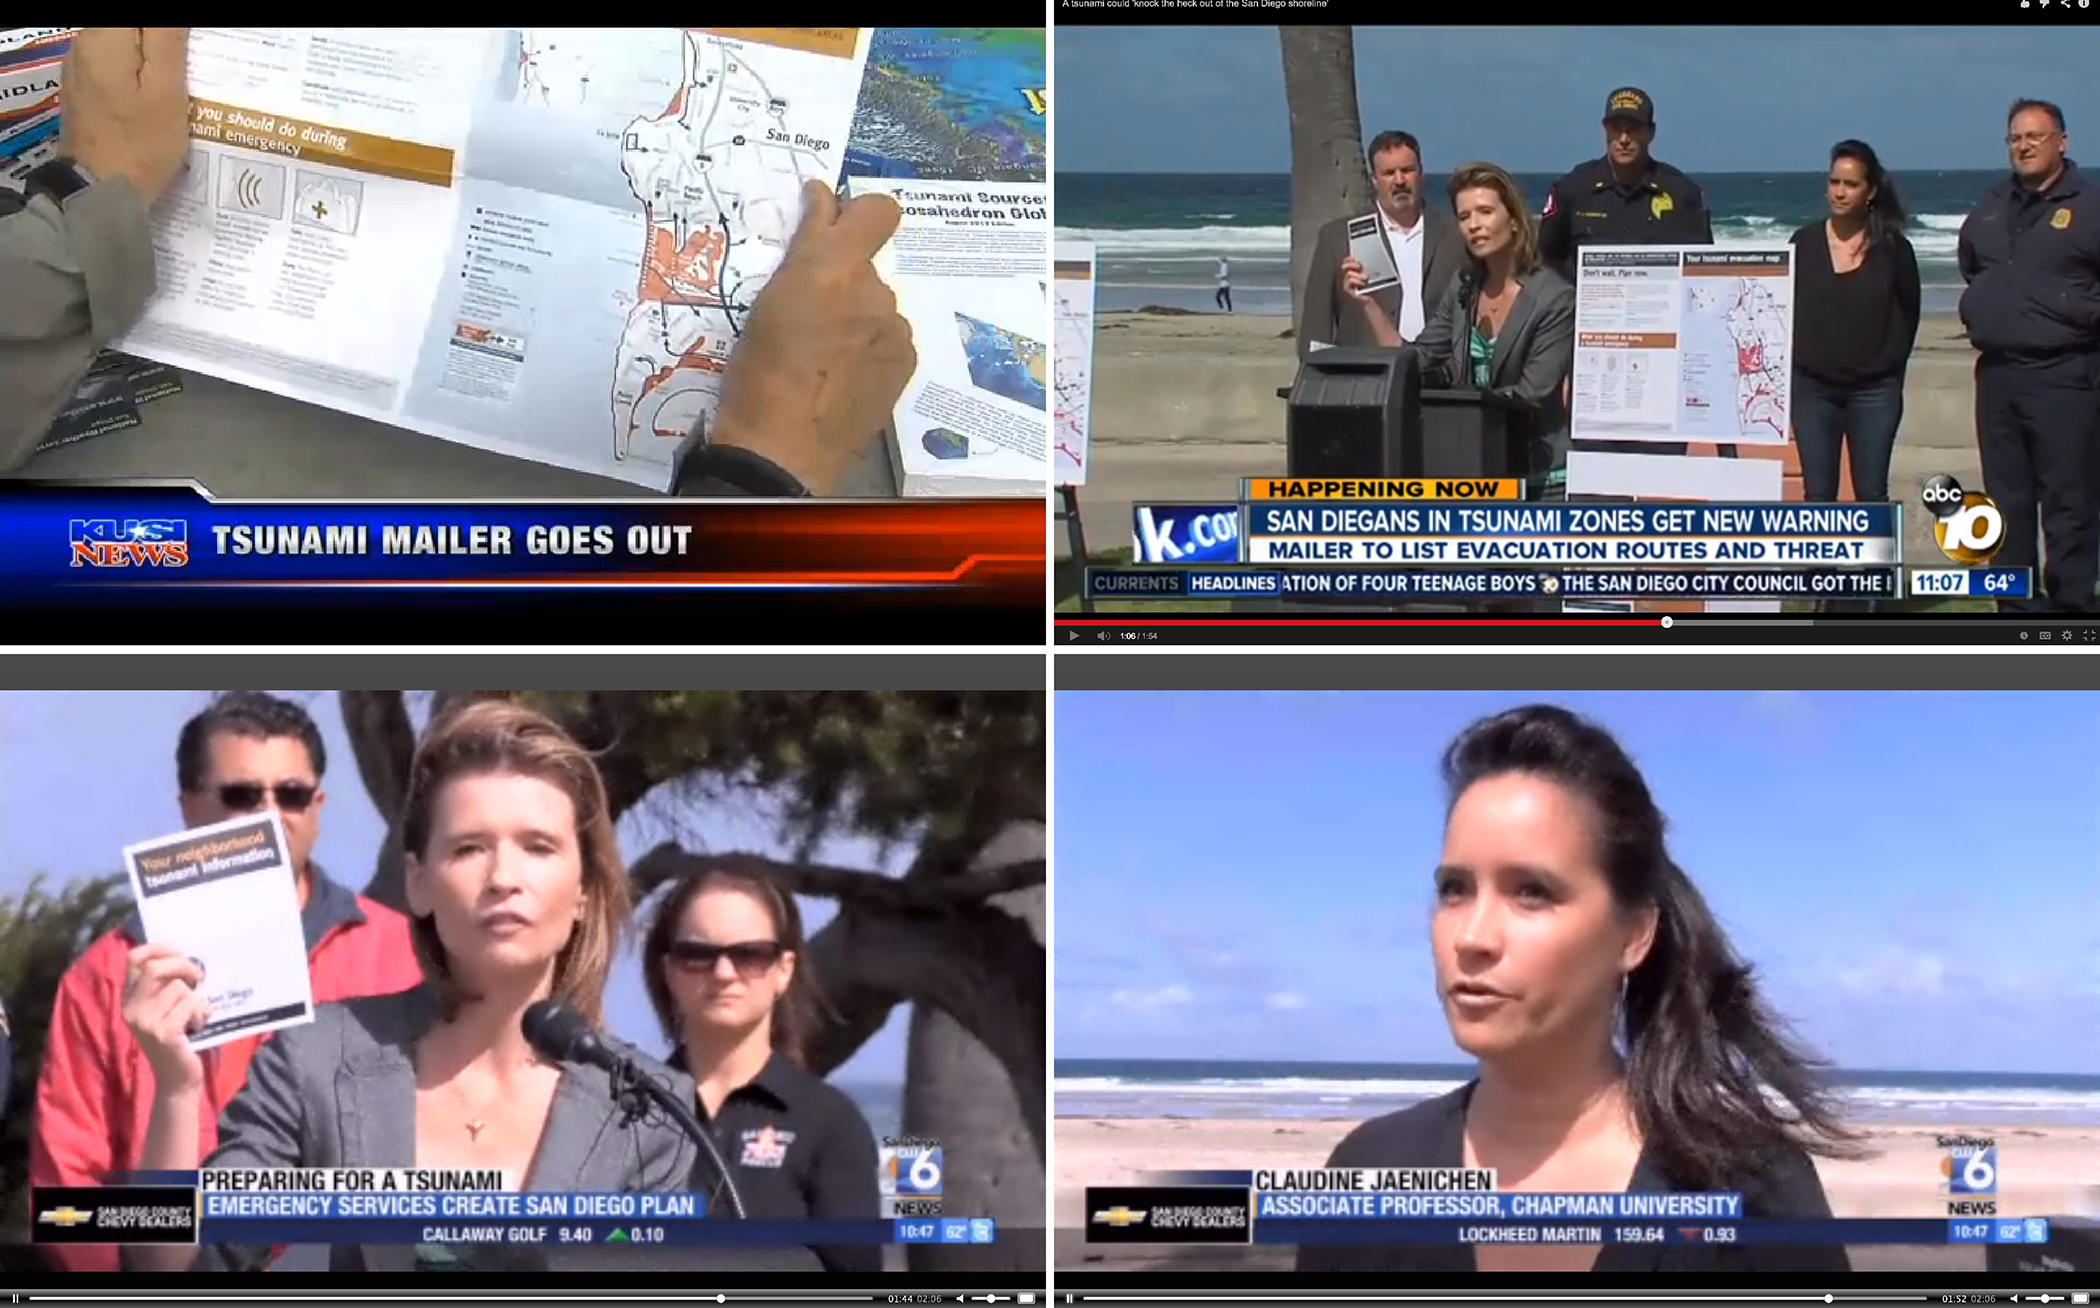
San Diego County-wide mailing to all coastal residents


Orange County
Disclaimer: Tsunami information and inundation area is reviewed and revised regularly by CalOES and CGS. The maps below do not reflect the most recent and updated changes. Please do not refer to these maps in an emergency situation. Refer to your local emergency management department in your city for updates.


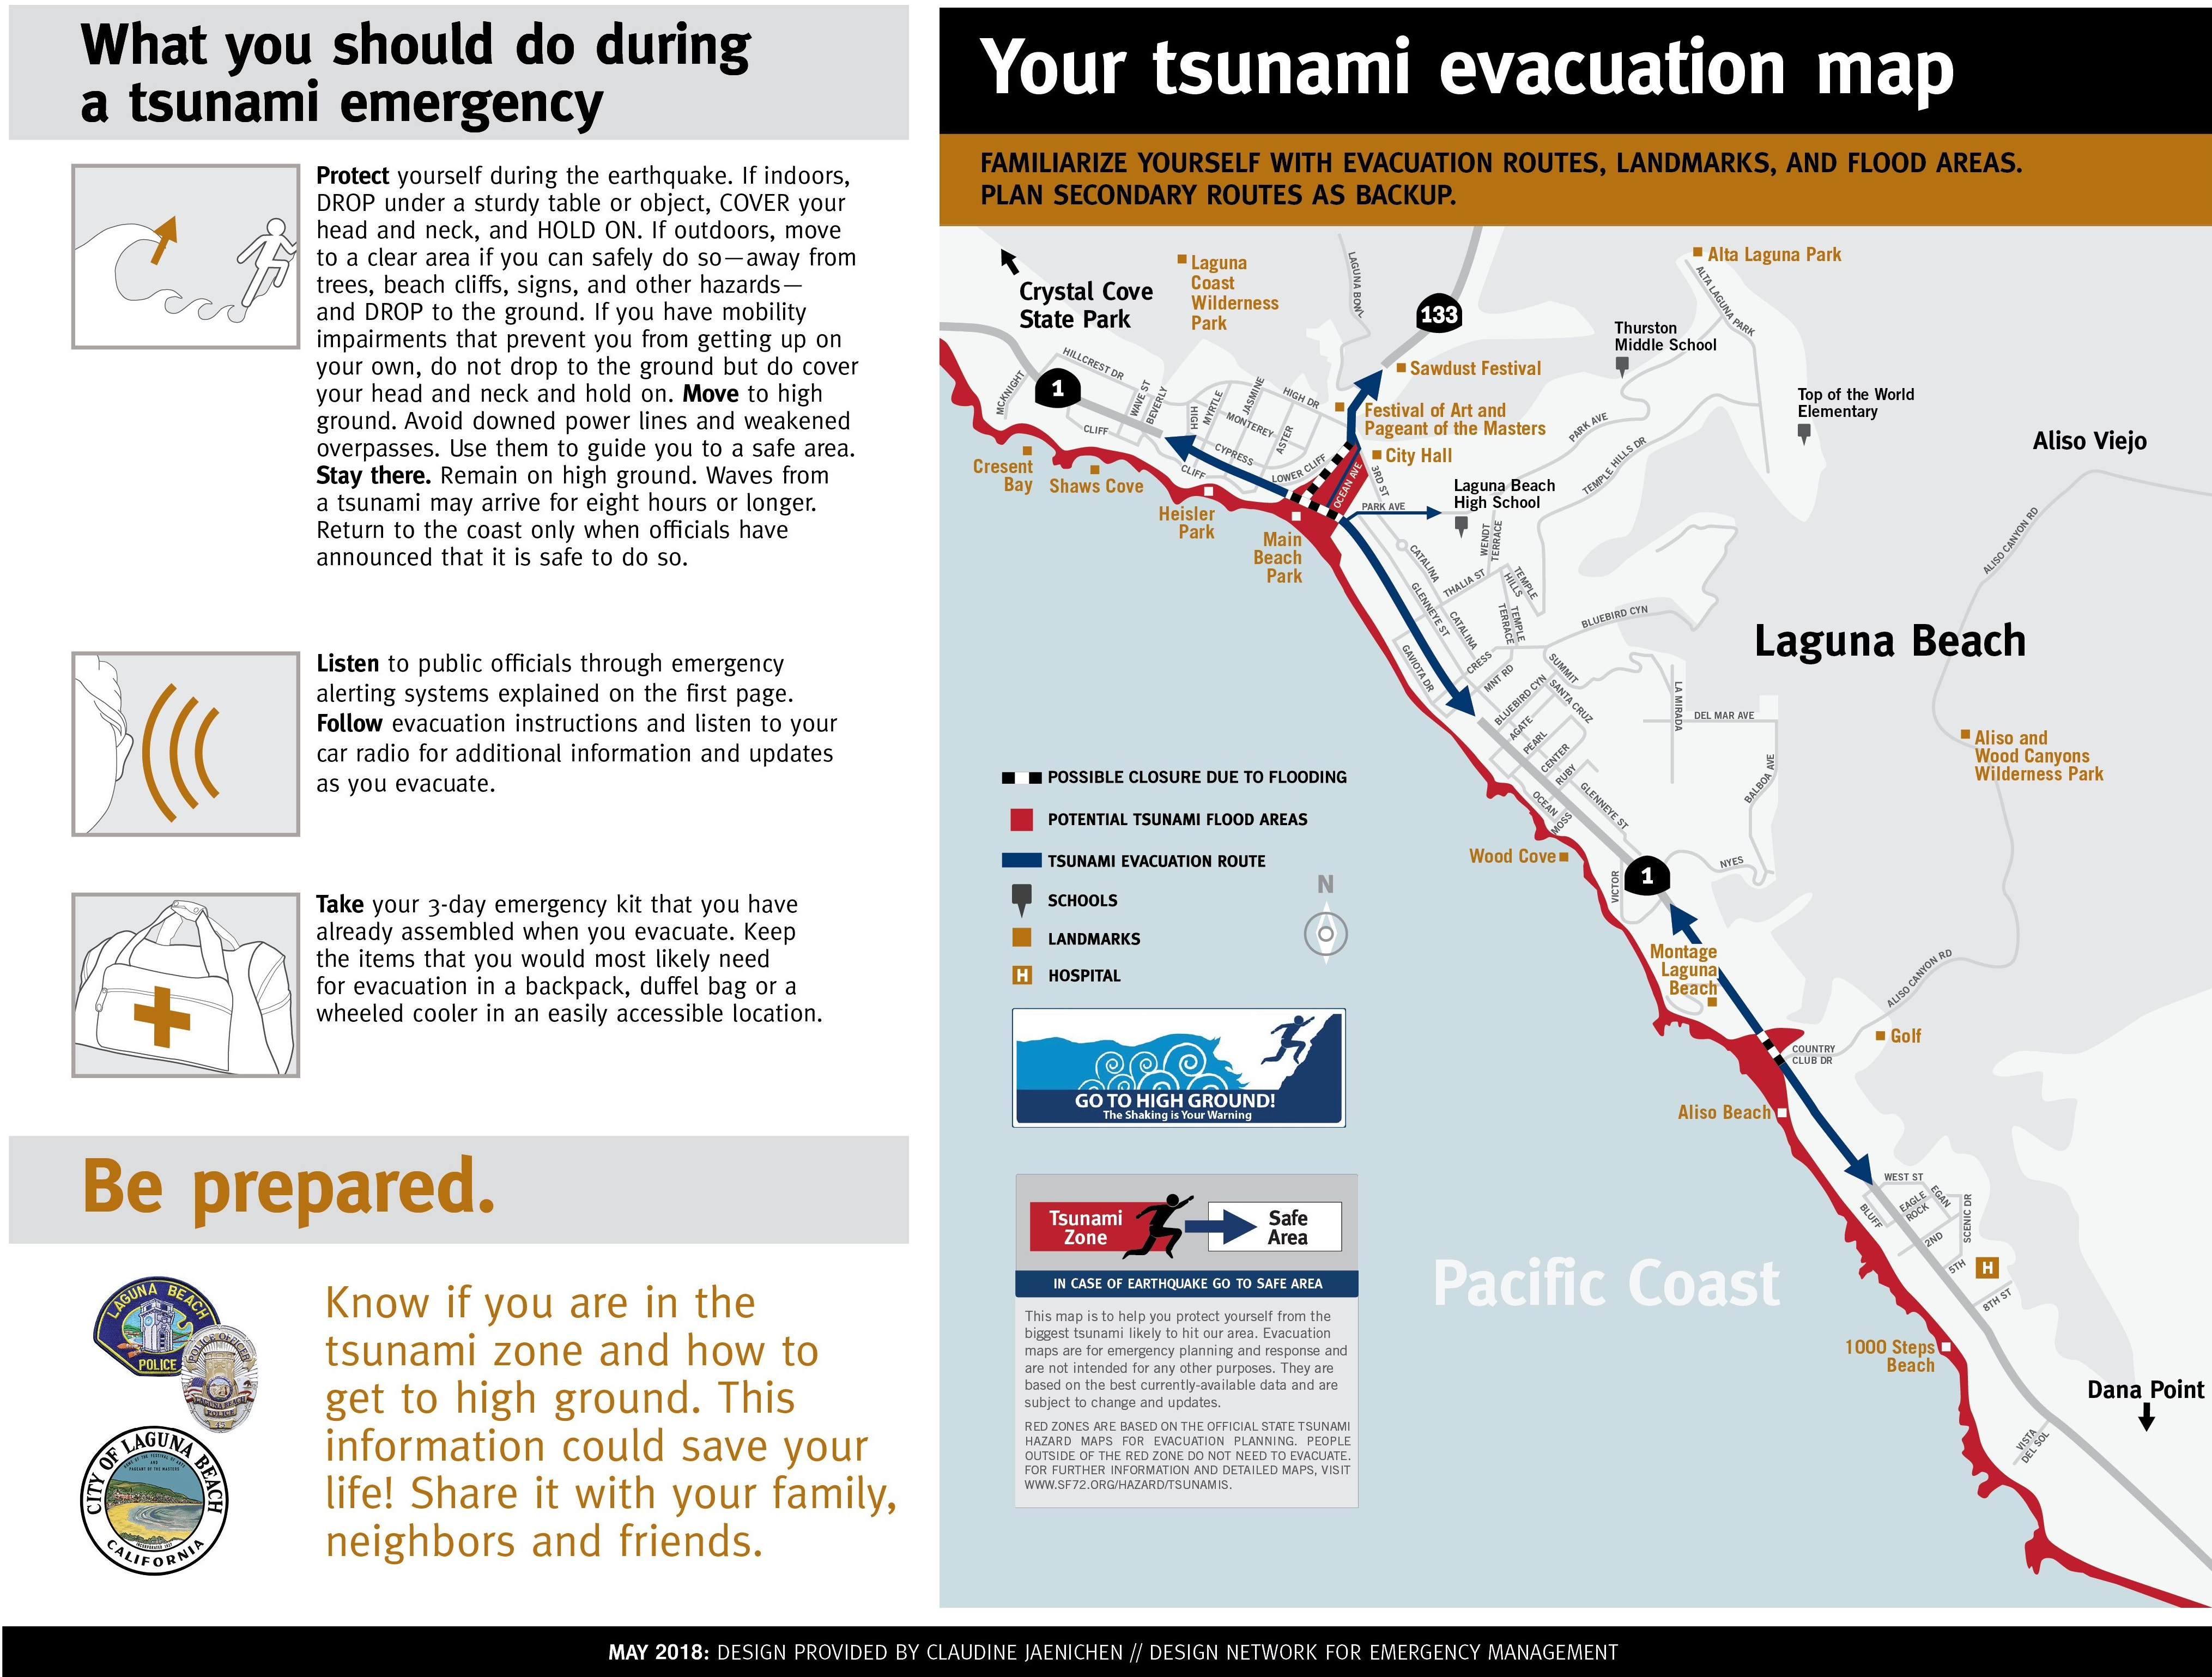
Los Angeles County
Disclaimer: Tsunami information and inundation area is reviewed and revised regularly by CalOES and CGS. The maps below do not reflect the most recent and updated changes. Please do not refer to these maps in an emergency situation. Refer to your local emergency management department in your city for updates.


Northern California
Disclaimer: Tsunami information and inundation area is reviewed and revised regularly by CalOES and CGS. The maps below do not reflect the most recent and updated changes. Please do not refer to these maps in an emergency situation. Refer to your local emergency management department in your city for updates.